With all due respect to Nate Silver and the 538 crew, anybody with an old TI-82 can invent an algorithm and build a statistical model and use other math jargon I’ve never heard of to predict the winner of every NCAA Tournament game… What would be really impressive, however, is to pick the loser of every NCAA Tournament game.
Yes, it’s easy to push all the #16 seeds past the #1 seeds, and all the #15 seeds past the #2s, but what happens after that? In the Silver model, we have actual games to decide the results. In this version, we have no reality to speak of. How do you decide who would win in a Wofford v. Mercer 2nd round match-up? What do you do when you have a #15 seed American v. #16 seed Weber State in the Elite Eight? Has anyone crunched the numbers on that scenario? Where are your sample sizes for that epic battle?
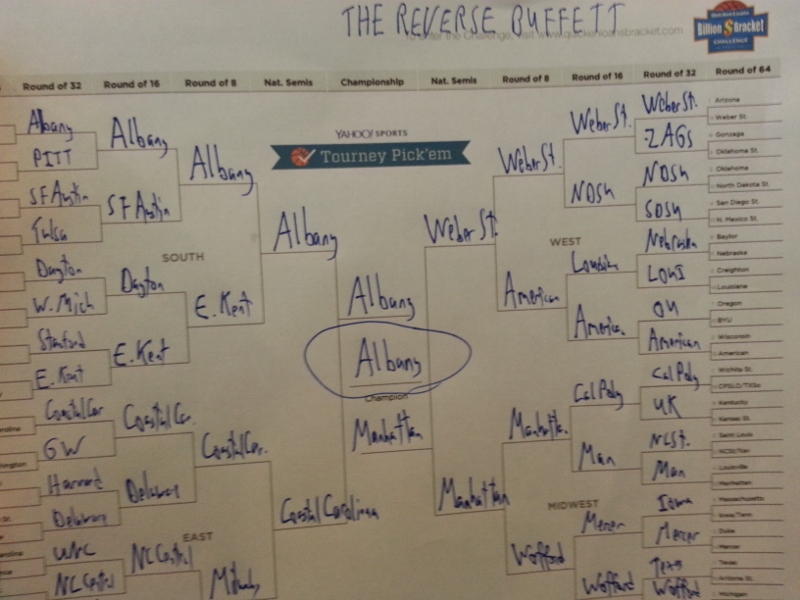
Rather than bore you with the stats and figures and hard analysis that was necessary to complete the Bizarro Bracket, I will simply provide a picture below. Whether you’re picking winners or losers, the middle-seed games are still tough.
But once you get past the first two rounds, you have to resist the temptation to go all chalk. That’s why I took Manhattan to upend Cal Poly and Wofford to make it to the futile Final Four.
That lead to a match-up of Manhattan against their upstate New York brethren, the University at Albany in the Final. From there, in a victory for the state capitol over the de facto capitol of the world, the Great Danes shock the universe to take home the championship. Ladies and gentleman, your Reverse Buffet Bracket:
